










Custom reporting and performance dashboards for clearer Amazon decisions

Sell Insights turns sales, profitability, PPC, conversion, inventory, and operational data into one focused reporting system. Your team gets clearer visibility, faster issue detection, and a practical view of what needs attention next.
Start with clarity

Talk to an Amazon strategist

Services Page Form
$ 0 M+

Combined Client Revenue

0 +
Brands Scaled on Amazon
< 0 Day
Average Response Time
0 +
Years of Experience

What is a Custom Reporting and Performance Dashboard?

A custom performance dashboard organizes the account metrics that matter most into one clear view, helping your team understand performance, risks, completed work, and the next decision without relying on disconnected reports.

Relevant KPI framework

The dashboard is built around commercial goals, account priorities, and the decisions your team needs to make.

Connected performance context

Sales, advertising, conversion, profitability, inventory, and operational signals are reviewed together.

Action-ready reporting

Metrics are paired with observations, risks, ownership, and clear next priorities.

Six areas included in custom performance reporting

The reporting system is tailored to the account, team, goals, available data, and the decisions that need stronger visibility.

01

KPI Framework & Business Goals

We define the metrics, targets, timeframes, product priorities, and management questions the dashboard needs to support.

02

Sales & Profitability Reporting

Revenue, units, product trends, fees, margin pressure, promotions, and contribution signals are organized for clearer commercial review.

03

PPC & TACoS Visibility

Advertising spend, sales, ACoS, TACoS, campaign movement, search-term trends, and product-level efficiency are connected to the wider account.

04

Listing & Conversion Performance

Traffic, conversion, ranking movement, content changes, offer conditions, and product-page performance are tracked with useful context.

05

Inventory & Operational Risk Tracking

Stock cover, replenishment pressure, slow-moving inventory, seasonal exposure, and operational risks are surfaced before they disrupt growth.

06

Executive Dashboard & Action Reporting

Leadership receives a focused view of performance, completed work, risks, owners, and next priorities without unnecessary reporting noise.

How the custom reporting dashboard is built

A focused process keeps the dashboard useful, readable, and connected to the decisions your team makes.

01

Define the decisions

We identify goals, audiences, recurring questions, reporting gaps, and the account areas that need clearer visibility.

02

Organize the data

Available account reports and approved data sources are mapped into a consistent performance structure.

03

Build the dashboard

KPIs, trends, comparisons, risks, notes, and action fields are arranged around practical review needs.

04

Review and refine

The reporting view is checked with your team and improved as priorities, products, and management needs change.
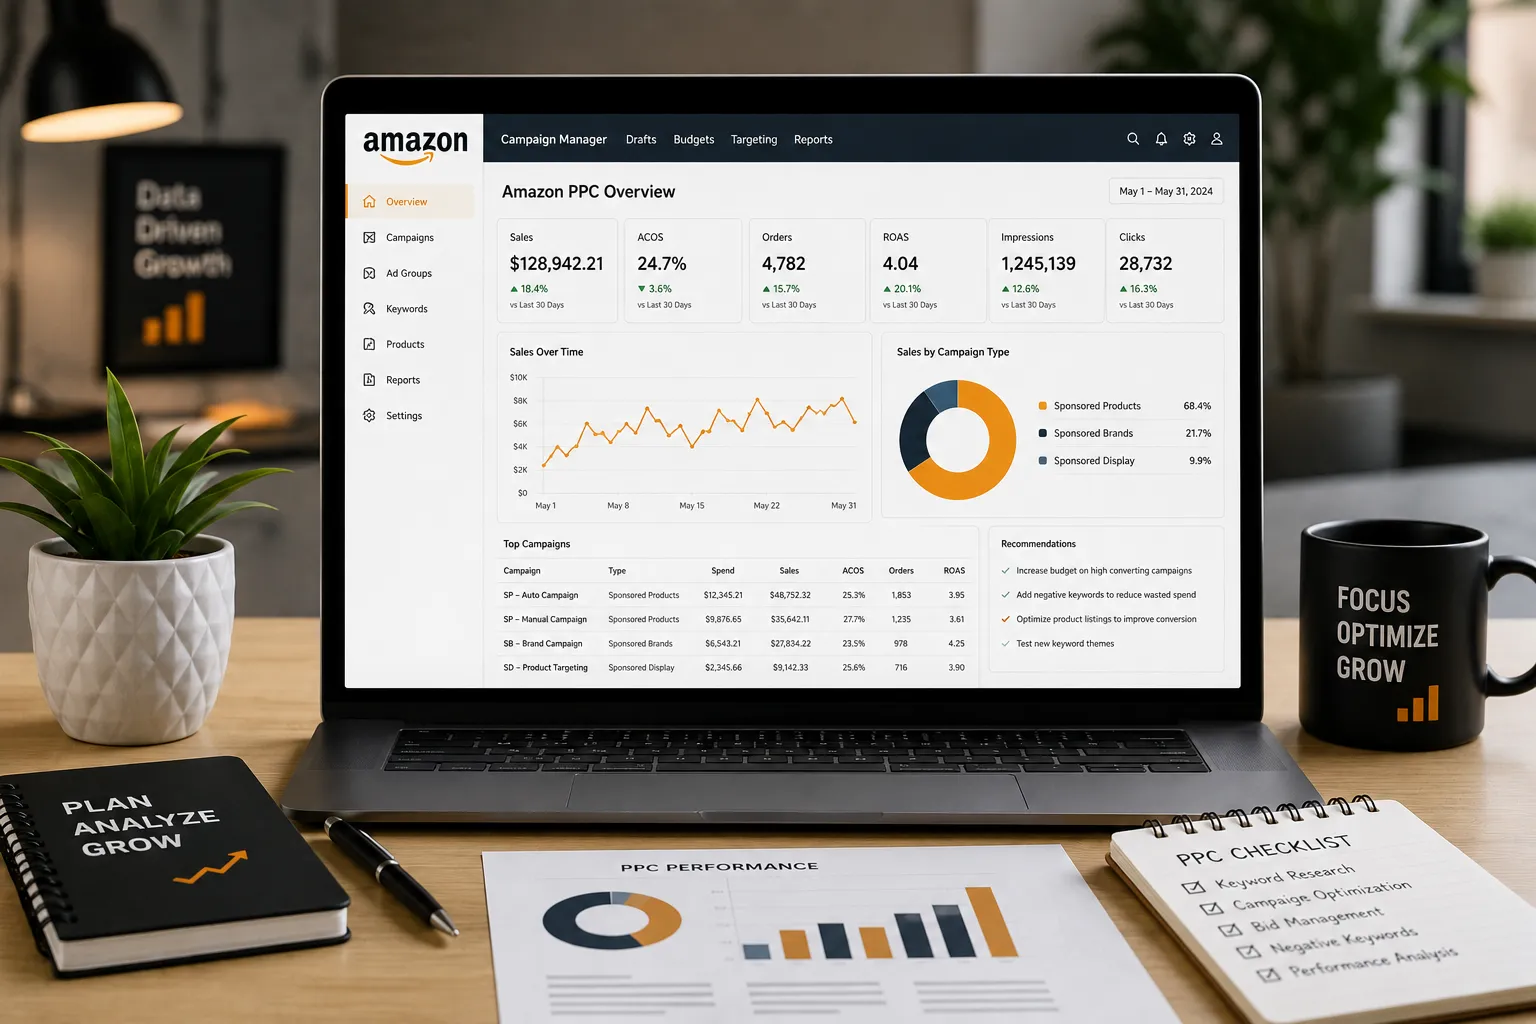
When more reports create less clarity

An active brand may have separate files for sales, advertising, inventory, listings, and completed work, yet still struggle to explain what changed or what deserves attention first. A custom dashboard removes reporting noise, connects the most important signals, and gives decision-makers one practical performance view.

Custom performance dashboard vs disconnected reporting

The difference is not simply how many metrics appear. Useful reporting connects the right numbers to context, ownership, and the next decision.
Reporting Area Disconnected Reports Sell Insights Dashboard Practical Result
KPI Selection Every report includes different metrics and definitions One agreed KPI framework follows the commercial goal Consistent performance reviews
Account Context Sales, PPC, conversion, and inventory are viewed separately Key account signals are connected in one management view Better diagnosis and prioritization
Trend Visibility Teams react to isolated daily or weekly movements Trends, comparisons, exceptions, and product movement are easier to see Faster issue detection
Action Tracking Metrics are shared without clear owners or follow-through Observations, actions, owners, and review points sit beside performance Stronger accountability
Leadership View Decision-makers receive lengthy reports with too much detail An executive view highlights outcomes, risks, and decisions required Clearer leadership communication
Reporting Rhythm Files are updated inconsistently across different teams A repeatable reporting and review process keeps information current More dependable visibility
Final Result A collection of spreadsheets and dashboard links A focused performance system built around account decisions More controlled account management

What the dashboard gives your team

The result is a clearer management view that reduces reporting noise, highlights meaningful changes, and helps the team move from metrics to action faster.

One source of performance truth

Important sales, advertising, conversion, inventory, profitability, and action data are organized into one consistent view.

Earlier risk and opportunity signals

Exceptions, trend changes, product movement, and operational pressure are easier to identify before decisions become reactive.

Clearer action ownership

Performance observations are connected to priorities, owners, completed work, and the next review point.

Reporting built for account decisions, not vanity metrics

Sell Insights connects reporting to account management, commercial priorities, completed work, and the decisions needed to protect profitable growth.

01

Evidence-led assuBuilt around decisionsmptions

The dashboard starts with the questions your team needs to answer, not a fixed list of charts.

02

Connected account view

Sales, PPC, listings, conversion, inventory, and profitability are reviewed in the same context.

03

Context before conclusions

Metrics are supported by trends, changes, risks, and practical observations instead of isolated percentages.

04

Consistent follow-through

Reporting shows what changed, what was completed, what remains at risk, and what comes next.

Clearer strategy and stronger execution for Amazon growth

Sell Insights connects account management, PPC, listings, creative, analytics, inventory awareness, and reporting so teams can make clearer decisions and execute with stronger control.

Scoreboard Mentality

We focus reporting on the numbers that explain performance, profitability, risks, and progress.

Convergent Strategy

Account work and performance reporting follow the same commercial priorities.

Attention to detail

Definitions, trends, data gaps, and reporting inconsistencies are reviewed carefully.

Excellence in execution

Dashboards and reporting routines are checked, maintained, and communicated clearly.

Who needs a Custom Reporting and Performance Dashboard?

This service is useful when account data exists, but the team still lacks a clear, trusted, and action-focused performance view.

01

Too many disconnected files

Sales, PPC, inventory, listings, and project updates live in separate spreadsheets or reports with no shared context.

02

Reports do not explain the next step

The team can see metrics but cannot quickly identify the cause, risk, owner, or priority action.

03

Leadership needs clearer visibility

Decision-makers need a focused view of performance, profitability, risks, progress, and upcoming decisions.

04

Growth has increased reporting complexity

More products, campaigns, markets, or team members have made manual reporting harder to maintain and trust.

What reporting dashboard clients value

Clear KPIs, readable dashboards, connected account context, and action-focused reporting are central to the service.

Turn account data into a clearer performance system

Discuss your current reports, account priorities, team needs, and recurring performance questions with Sell Insights. We will help define the right dashboard scope.

Frequently Asked Questions

Clear answers about scope, metrics, existing reports, update frequency, and how the dashboard supports account management.
The agreed scope can include KPI planning, sales and profitability reporting, PPC visibility, listing and conversion metrics, inventory tracking, executive summaries, trend analysis, action tracking, and recurring reporting. The final dashboard depends on your data, account priorities, and reporting needs.
The dashboard gives one connected view of performance, risks, completed work, and next priorities. This helps account decisions stay aligned with commercial goals instead of relying on separate reports.
Metrics may include revenue, units sold, profitability, ACoS, TACoS, conversion, traffic, ranking, inventory, operational risks, completed actions, and other agreed KPIs. Only decision-focused metrics are included.
Yes. Existing dashboards, spreadsheets, and reporting processes can be reviewed for gaps, duplication, missing context, and usability. Sell Insights can improve the current system or recommend a better structure.
The reporting schedule depends on your account, available data, and management needs. Dashboards may be updated daily, weekly, or monthly, with the review cadence agreed during onboarding.