












Combined Client Revenue
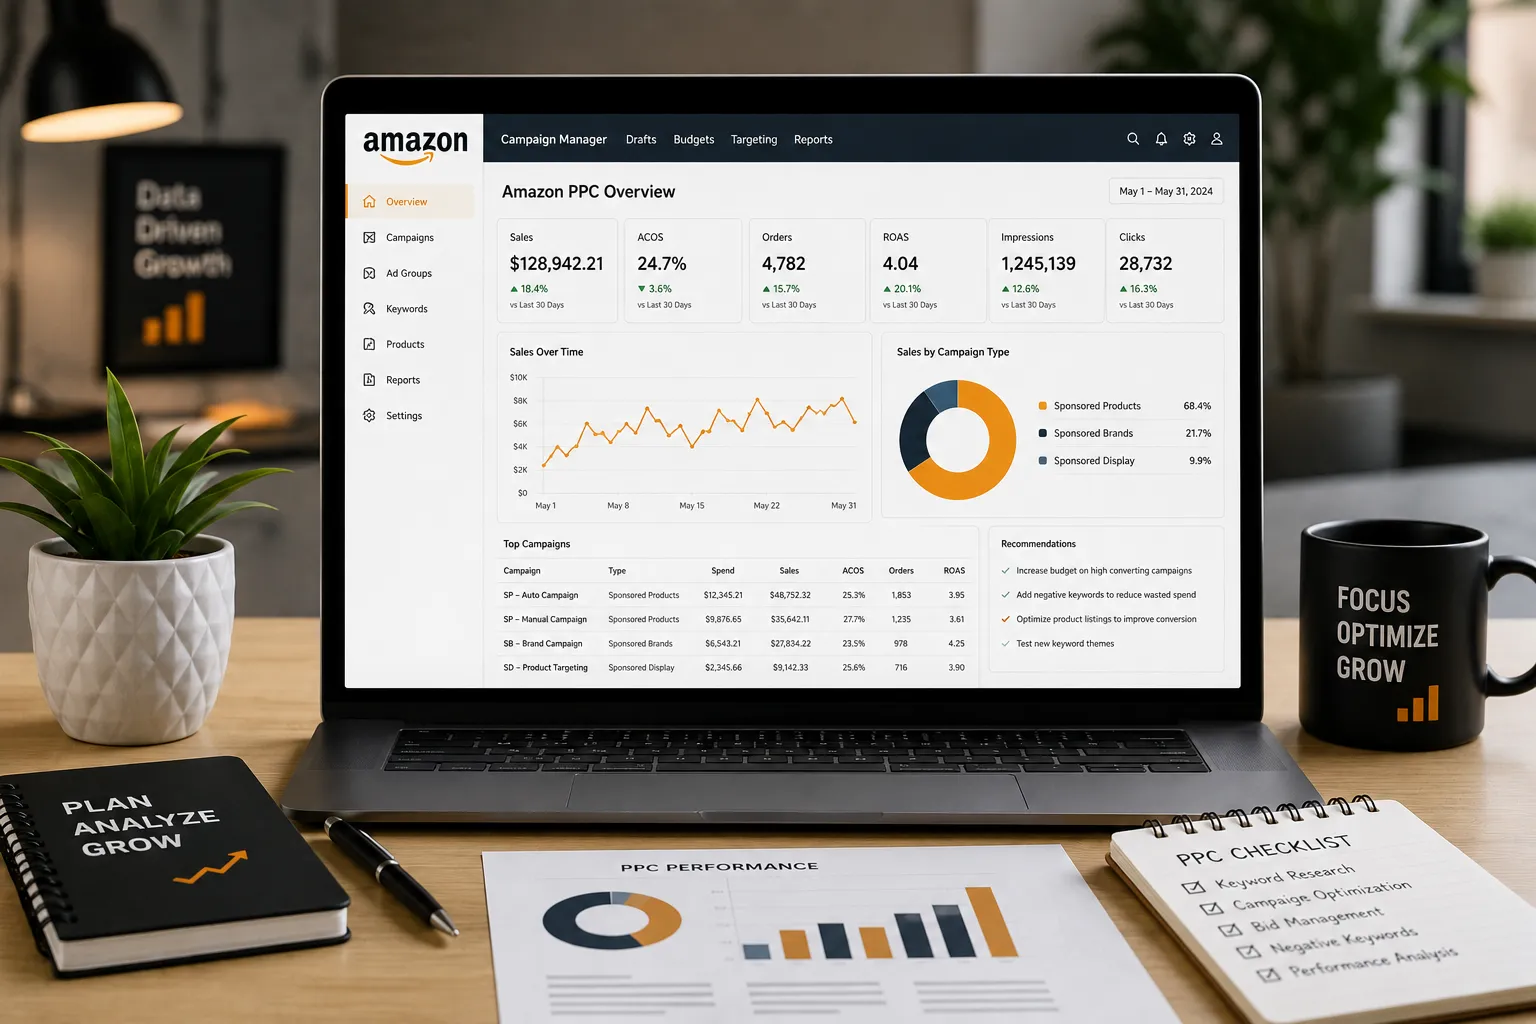
The dashboard is built around commercial goals, account priorities, and the decisions your team needs to make.
Sales, advertising, conversion, profitability, inventory, and operational signals are reviewed together.
Metrics are paired with observations, risks, ownership, and clear next priorities.

We identify goals, audiences, recurring questions, reporting gaps, and the account areas that need clearer visibility.
Available account reports and approved data sources are mapped into a consistent performance structure.
KPIs, trends, comparisons, risks, notes, and action fields are arranged around practical review needs.
The reporting view is checked with your team and improved as priorities, products, and management needs change.
| Reporting Area | Disconnected Reports | Sell Insights Dashboard | Practical Result |
|---|---|---|---|
| KPI Selection | Every report includes different metrics and definitions | One agreed KPI framework follows the commercial goal | Consistent performance reviews |
| Account Context | Sales, PPC, conversion, and inventory are viewed separately | Key account signals are connected in one management view | Better diagnosis and prioritization |
| Trend Visibility | Teams react to isolated daily or weekly movements | Trends, comparisons, exceptions, and product movement are easier to see | Faster issue detection |
| Action Tracking | Metrics are shared without clear owners or follow-through | Observations, actions, owners, and review points sit beside performance | Stronger accountability |
| Leadership View | Decision-makers receive lengthy reports with too much detail | An executive view highlights outcomes, risks, and decisions required | Clearer leadership communication |
| Reporting Rhythm | Files are updated inconsistently across different teams | A repeatable reporting and review process keeps information current | More dependable visibility |
| Final Result | A collection of spreadsheets and dashboard links | A focused performance system built around account decisions | More controlled account management |
Important sales, advertising, conversion, inventory, profitability, and action data are organized into one consistent view.
Exceptions, trend changes, product movement, and operational pressure are easier to identify before decisions become reactive.
Performance observations are connected to priorities, owners, completed work, and the next review point.
The dashboard starts with the questions your team needs to answer, not a fixed list of charts.
Sales, PPC, listings, conversion, inventory, and profitability are reviewed in the same context.
Metrics are supported by trends, changes, risks, and practical observations instead of isolated percentages.
Reporting shows what changed, what was completed, what remains at risk, and what comes next.
We focus reporting on the numbers that explain performance, profitability, risks, and progress.
Account work and performance reporting follow the same commercial priorities.
Definitions, trends, data gaps, and reporting inconsistencies are reviewed carefully.
Dashboards and reporting routines are checked, maintained, and communicated clearly.

Sales, PPC, inventory, listings, and project updates live in separate spreadsheets or reports with no shared context.
The team can see metrics but cannot quickly identify the cause, risk, owner, or priority action.
Decision-makers need a focused view of performance, profitability, risks, progress, and upcoming decisions.
More products, campaigns, markets, or team members have made manual reporting harder to maintain and trust.
Professional Cleaning Supplies Brand
Consumer Electronics Accessories Brand
Organic Bedding Brand